I blend my business knowledge, creativity and critical thinking with data analytical skills to squeeze and showcase every ounce of insights from data, using reports and dashboard visualizations, helping stakeholders solve their business problems.
Faucibus sed tristique fames sed aliquet ultricies eget viverra arcu. Vitae faucibus diam consequat aecenas. Turpis metus sit diam purus leo in varius ac quam. Nunc amet tristique set volutpat estars adipiscing vulputate est phasellus. Volutpat faucibus per praesent aced nuncare voltare per settera lorem ipsum dolor.
Gathering data from different sources such as Excel, CSV, APIs & databases etc.
VISUALIZE
Creating periodic reports from analysis to highlight KPIs, trends and insights
TRANSFORM
Cleaning datasets by correcting invalid data types or values, outliers and non-relevant data to fit model for analysis
PRESENT
Presenting insights from data to teams using dashboards and charts to drive informed decision-making.
ABOUT
7 Years of experience using data to drive informed business decisions in creating digital experiences and developing compelling stories for more than 10 brands.
After working as a digital marketing strategist experienced in using data to make informed business decisions, I decided to focus on analysing large datasets to find patterns within them, transforming data into insights and creative visual dashboards.
I have expertise in the whole range of data analytics, from data extraction, cleaning, exploring and transformation, to visual presentation.
Part data nerd, part data detective; my skillset ranges from writing functions, queries and scripts for MS Excel, SQL and Python, to delivering reports that interpret and visualize your data insights, using MS PowerBI, Tableau & Excel for charts and dashboards.
Lorem ipsum dolor sit amet, consectetur adipiscing elit. Viverra tristique placerat in sat massa consectetur quisque. Nunc aces fames lectus in libero aliquet ertare feraso est lorem nunc dolor sit amet settera aces volutpat in voltare lupar est phasellus.
5% of all bottom-line earnings go to the following cancer charities: Macmillan Cancer Support, Friends of Anchor, Jo’s Cervical Cancer Trust and The Butterfly Thyroid Cancer Trust. As a cancer survivor, I understand the need for these groups in providing emotional support and care to cancer patients.
SKILLS
Let me help you translate your data into valuable insights with my expertise.
Viverra tristique placerat in sat massa consectetur quisque. Nunc aces fames lectus in libero aliquet ertare feraso est lorem nunc dolor sit amet settera aces volutpat in voltare lupar est phasellus. Faucibus sed tristique fames sed aliquet ultricies eget viverra arcu.
EXCEL
SQL
PYTHON
TABLEAU
POWER BI
EXPLORATION
WRANGLING
VISUALIZING
VISUALIZATIONS
2015
2013 - 2015 • Generated weekly reports (editing & approvals) containing dashboards, charts, and graphs that led to 21% improvement in strategic decision making, using MS Excel, MS PowerPoint, and Microsoft SQL Server.
2017
2015 - 2017 Leveraged insights from analysing datasets containing research on audience behaviour & psychographics to allocate budget
spends of over $200,000, thus achieving over 10M video views on YouTube and over 1M app downloads.
2019
2017 - 2019 Prepared data for exploratory analysis by cleaning inconsistent entries, errors and incorrect formatting from data using Python, with a 97.8% accuracy and thus reducing review time by 31%.
2020
2019 - 2020 Led a cross-functional team (online, creative, PR) of 7 members, creating and executing brand campaigns for clients
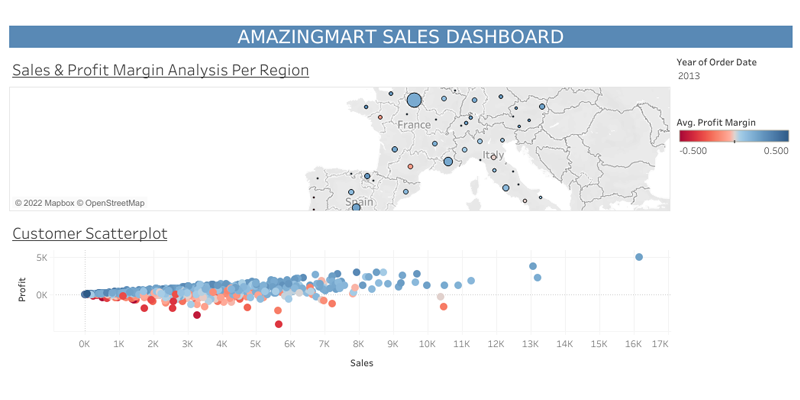
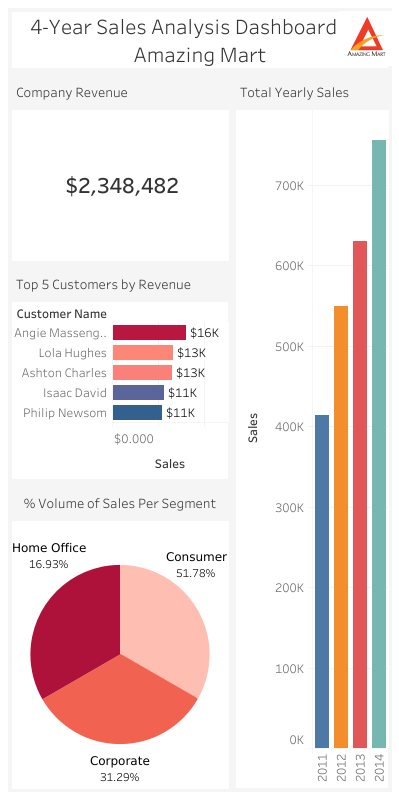
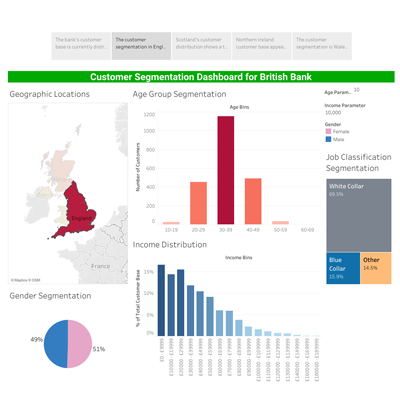
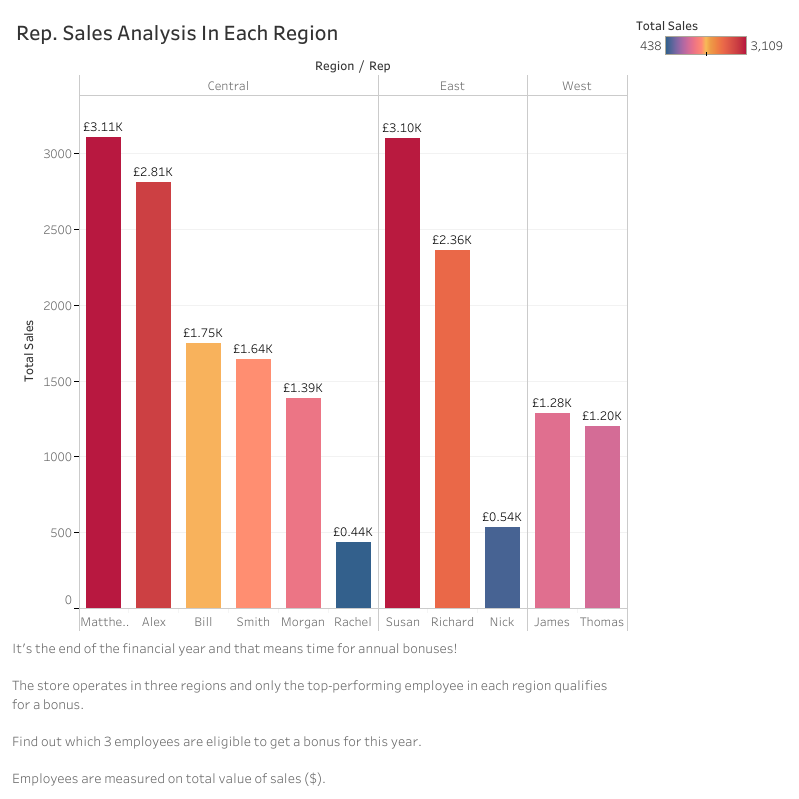
A glimpse of some dashboards and data visualizations I’ve created with Tableau & MS PowerBI to showcase insights from data, reports and periodic trends.